Km

The Michaelis constant, Km, is a parameter in the Michaelis-Menten equation. Km is equal to the substrate concentration where the corresponding reaction rate is ½ • Vmax. An enzyme with a low Km, therefore, achieves its half-maximal velocity at a low substrate concentration, while an enzyme with a high Km needs high substrate concentrations to achieve this velocity. It has been experimentally shown, that Km of an enzyme is usually close to the cellular concentration of its substrate. For an enzymatic reaction involving 2 steps, where the second step is rate-limiting, Km is approximately equal to the dissociation constant of the ES complex. In this case, a low Km implies a high affinity for the substrate; however, this interpretation of Km is only valid for a few enzymes [1]. K m, is a parameter in the Michaelis-Menten equation. K m is equal to the substrate concentration where the corresponding reaction rate is half of V max. An enzyme with a low K m, therefore, achieves its half-maximal velocity at a low substrate concentration, while an enzyme with a high K m needs high substrate concentrations to achieve this velocity. It has been experimentally shown, that K m of an enzyme is usually close to the cellular concentration of its substrate. For an enzymatic reaction involving 2 steps, where the second step is rate-limiting, K m is approximately equal to the dissociation constant of the E S complex. In this case, a low K m implies a high affinity for the substrate; however, this interpretation of K m is only valid for a few enzymes.
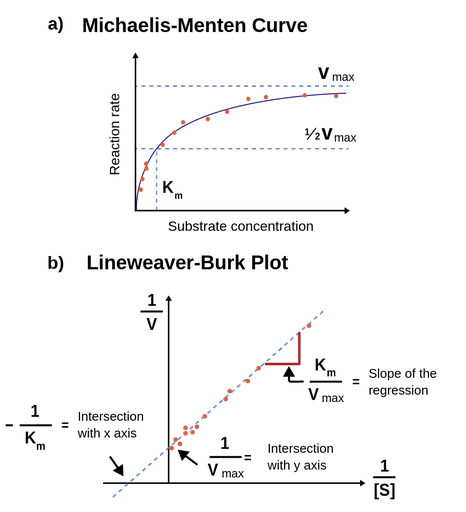
Figure 1a displays a graph of initial enzymatic reaction rates against substrate concentration, with the x-axis representing substrate concentration and the y-axis showing reaction rate. A Michaelis-Menten curve is fitted, indicating a rapid rate increase followed by a plateau. As substrate concentration rises, the reaction rate also increases but slows down as it approaches the maximum velocity, denoted as V max. The point where the reaction reaches 50% of V max is marked as "half of V max." Another parameter, k m, equals the substrate concentration at which the reaction rate is half of V max. Beneath, Figure 1b portrays the Lineweaver-Burk equation fitted to a double-reciprocal transformation of an enzyme kinetic dataset. The plot features 1 divided by the substrate concentration on the x-axis and 1 divided by V on the y-axis, resulting in an ascending straight line. The line intersects the y-axis and x-axis, marked with arrows. The slope of the regression on the line is highlighted with a red marker, providing valuable insights into the enzymatic reaction kinetics.

Figure 1: Figure 1a; Michaelis-Menten equation fitted to a plot of initial rates against substrate concentration. When the substrate concentration equals Km, the reaction rate is ½*Vmax. K m, the reaction rate is half of V max. Figure 1b; An illustration of the Lineweaver-Burk equation fitted to a double-reciprocal transformation of an enzyme kinetic dataset.

The Lineweaver-Burk equation

Several methods for determining Km exist. The most direct method is to plot V0 against [S] k m exist. The most direct method is to plot v 0 against the substrate concentration and use curve fitting software to fit the Michaelis-Menten equation directly. However, certain transformations allow determination via linear regression, and these transformations are also useful when analyzing enzyme inhibition. Several transformations are possible; however, a simple one is obtained by taking the reciprocal on both sides of the Michaelis-Menten equation. This leads to the following expression, called the Lineweaver-Burk equation:

1/V0 = 1/Vmax + Km/Vmax • 1/[S] the reciprocal of V 0 equals the reciprocal of V max plus k m divided by V max times the reciprocal of the substrate's concentration

This equation shows, that a plot of 1/V0 against 1/[S] should give a plot that can be fitted by a straight line with the y-intercept 1/Vmax and slope Km/Vmax. Thus, Km can be obtained using linear regression. Figure 1b shows an illustration of how to interpret the slope and intersects on a Lineweaver-Burk plot. [1] This equation shows, that a plot of the reciprocal of V 0 against the reciprocal of the substrate's concentration should give a plot that can be fitted by a straight line with the y-intercept reciprocal of V max and slope k m divided by V max. Thus, K m can be obtained using linear regression. Figure 1b shows an illustration of how to interpret the slope and intersects on a Lineweaver-Burk plot.

Other transformations

Notable, the Lineweaver-Burk transformation is not the only option. For example, a plot of [S]/V0 against [S] (a Hanes–Woolf plot) will also result in a straight line [2]. the substrate's concentration divided by V 0 against the substrate's concentration, a Hanes–Woolf plot, will also result in a straight line. However, in this case, we will use the Lineweaver-Burk transformation.

References

  1. Lehninger, Albert L.; Nelson, David L.; Cox, Michael M. (2008). Principles of Biochemistry (5th ed.). New York, NY: W.H. Freeman and Company. ISBN 978-0-7167-7108-1.

  2. Atkins, G.L. and Nimmo, I.A. (1975) A comparison of seven methods for fitting the Michaelis-Menten equation. Biochem. J. 149, 775-777.

Initial reaction rate

Vmax

Theory overview