Phase diagram
The phase diagram is a graph that represents the phases of a substance as a function of temperature and pressure. The diagram shows the phase-transition temperatures (melting points, sublimation points, boiling points) at different pressures.

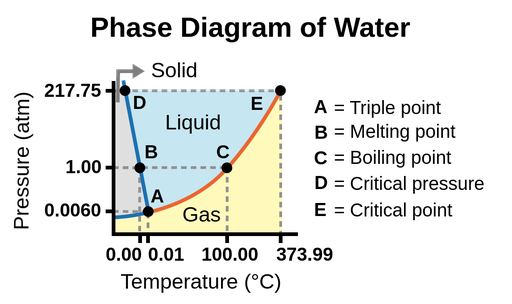
Figure 1. Phase diagram of water. The pressure and temperature axes are not drawn to scale.
- Triple point: Point where all three phases coexist in equilibrium. At pressure lower than the triple point, water cannot exist as a liquid, regardless of the temperature.
- Melting point: The temperature to melt ice.
- Boiling point: The temperature to evaporate water.
- Critical pressure: The pressure required to liquefy a gas at its critical temperature.
- Critical point: Critical temperature and critical pressure of a substance. Beyond the critical point, the physical properties of water are intermediate between gaseous and liquid states. This state is called supercritical fluid.
We can use the phase diagram to identify the physical state of a substance under specified conditions of pressure and temperature. For example, at
The solid/liquid boundary line has a negative slope, which means that the melting point of ice decreases as the external pressure increases. While the liquid/gas boundary line has a positive slope. This means the boiling point of water increase as the external pressure increases.